DETAILS AND LOCATION
Tower name
naselle_ridge
Institution
Bonneville Power Administration
First year
2010
Last year
2018
Tower type
Met mast
Measuring heights (m)
30
Contact
46.42, -123.8
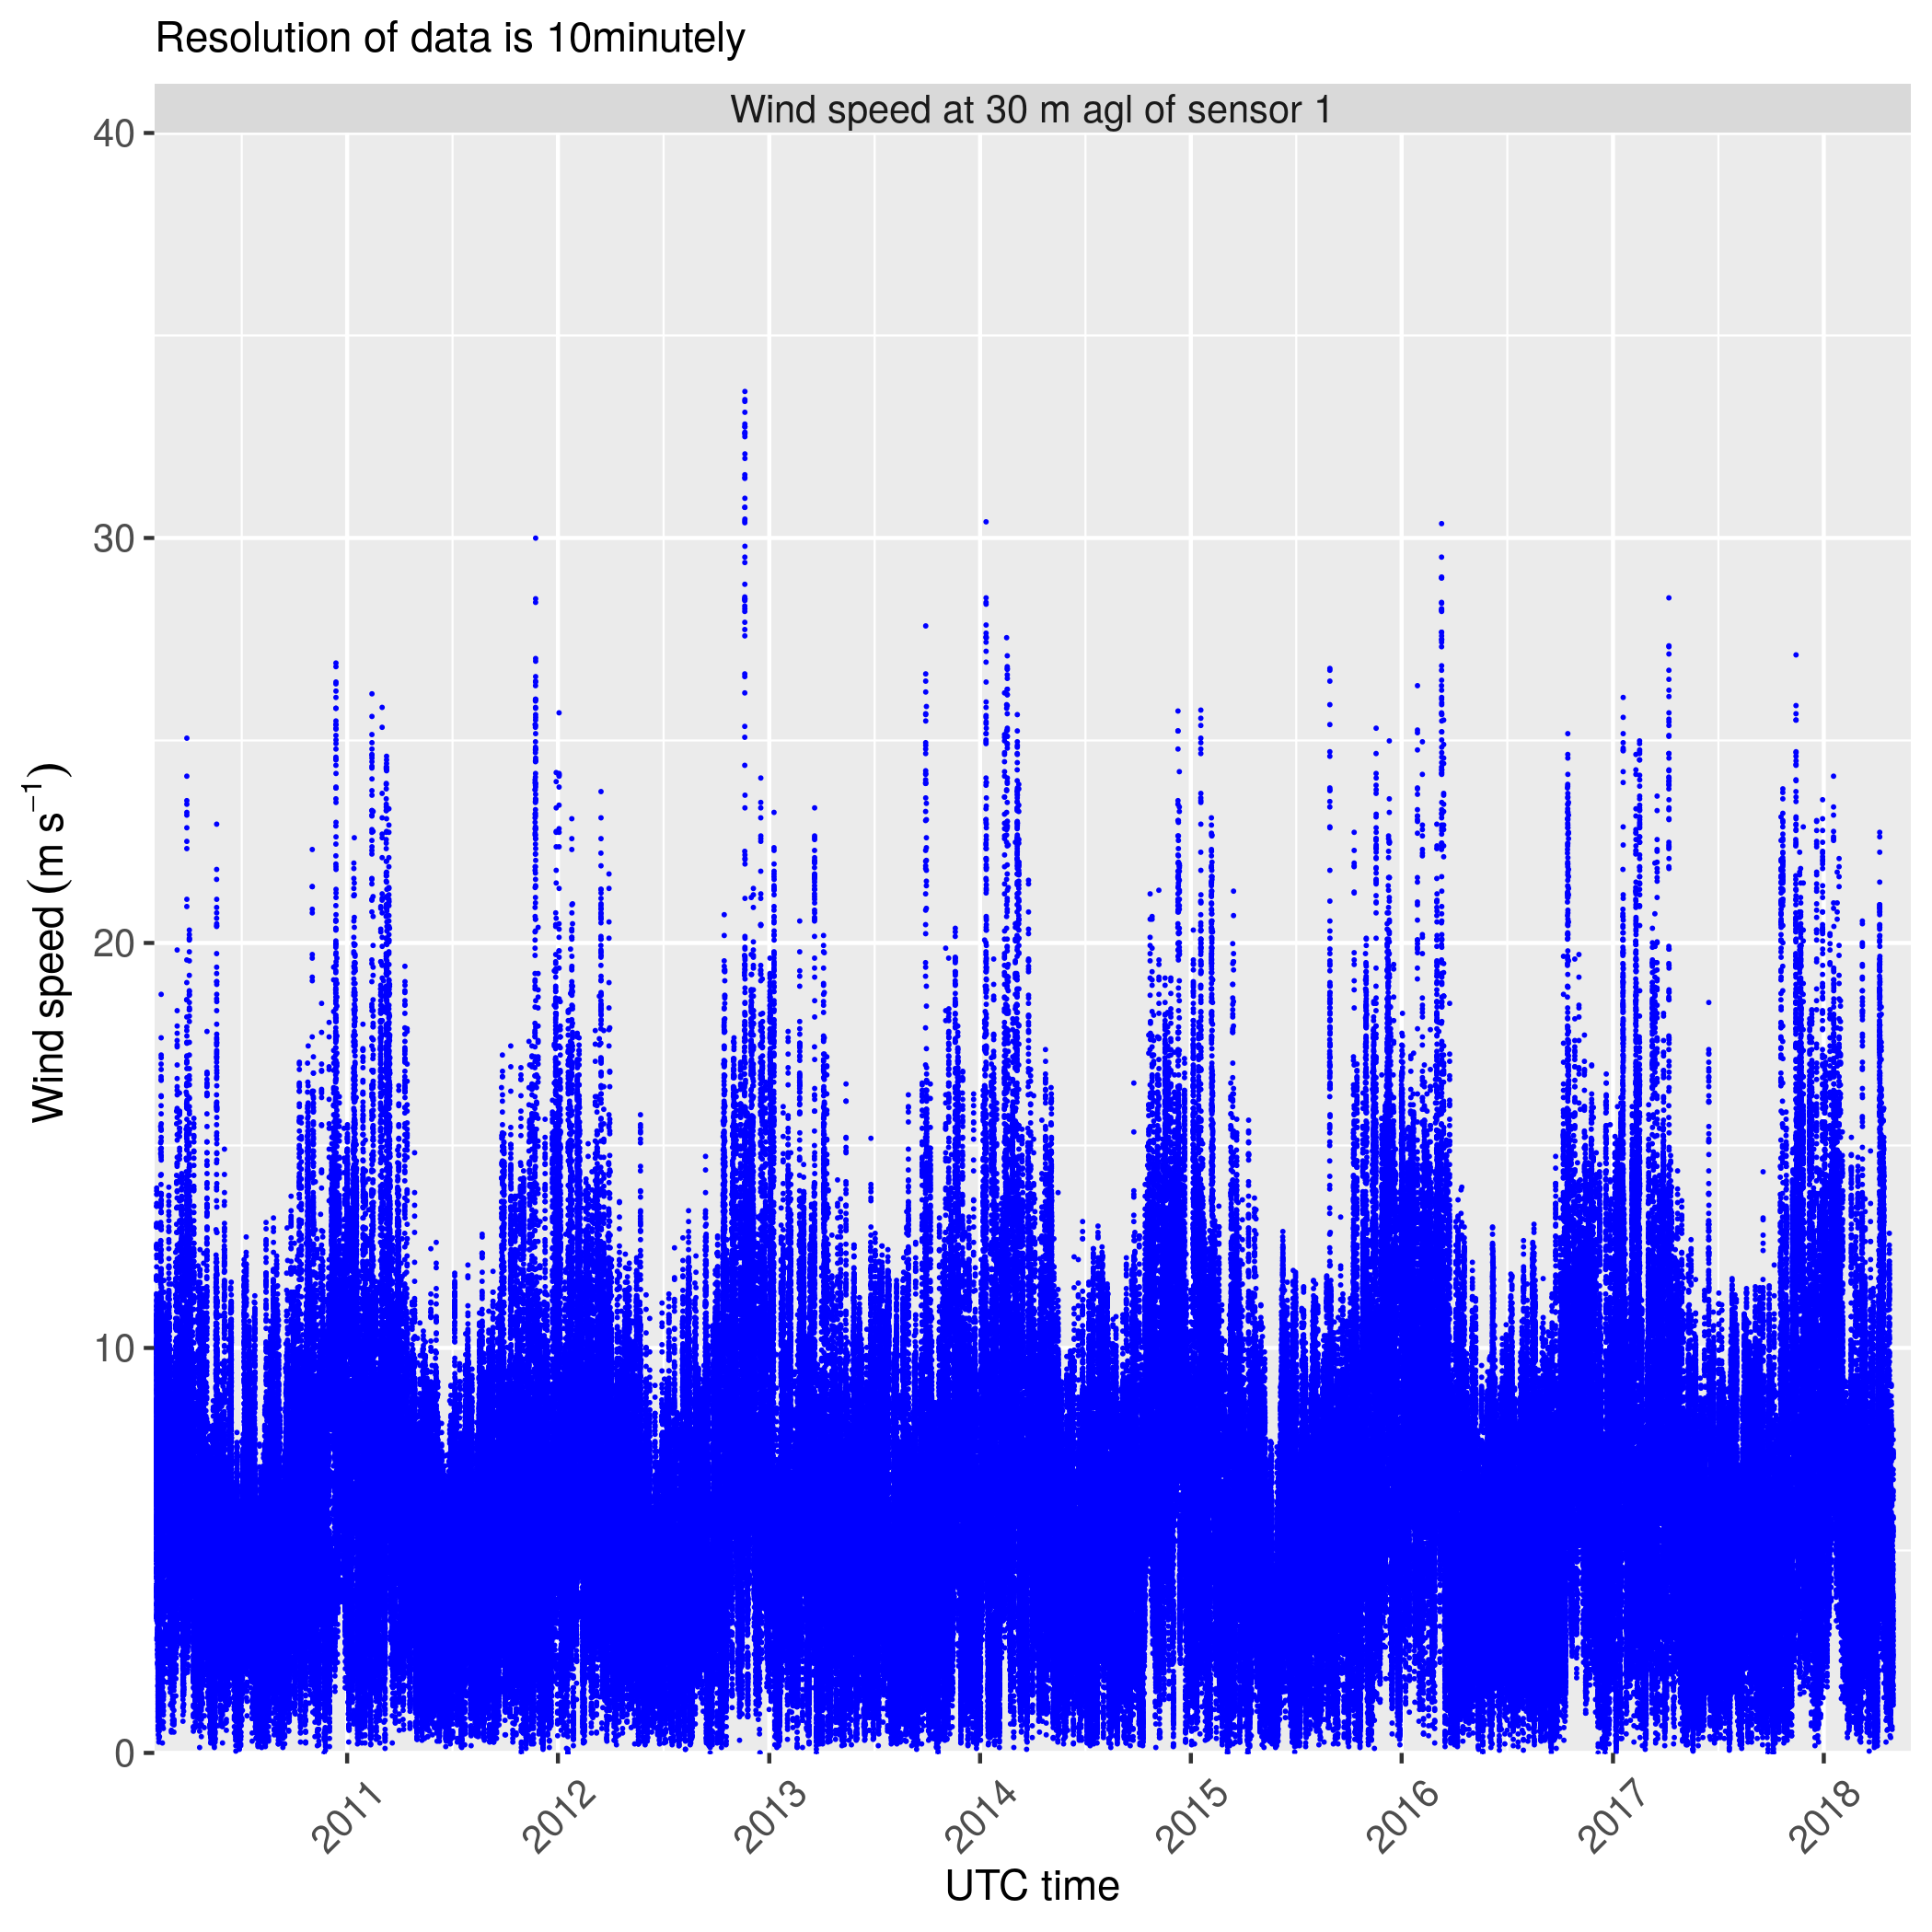
TIME SERIES
WIND SPEED SERIES AT THE DIFFERENT TOWER MEASURING LEVELS
MONTHLY TIME SERIES
MONTHLY WIND SPEED SERIES AT THE DIFFERENT TOWER MEASURING LEVELS

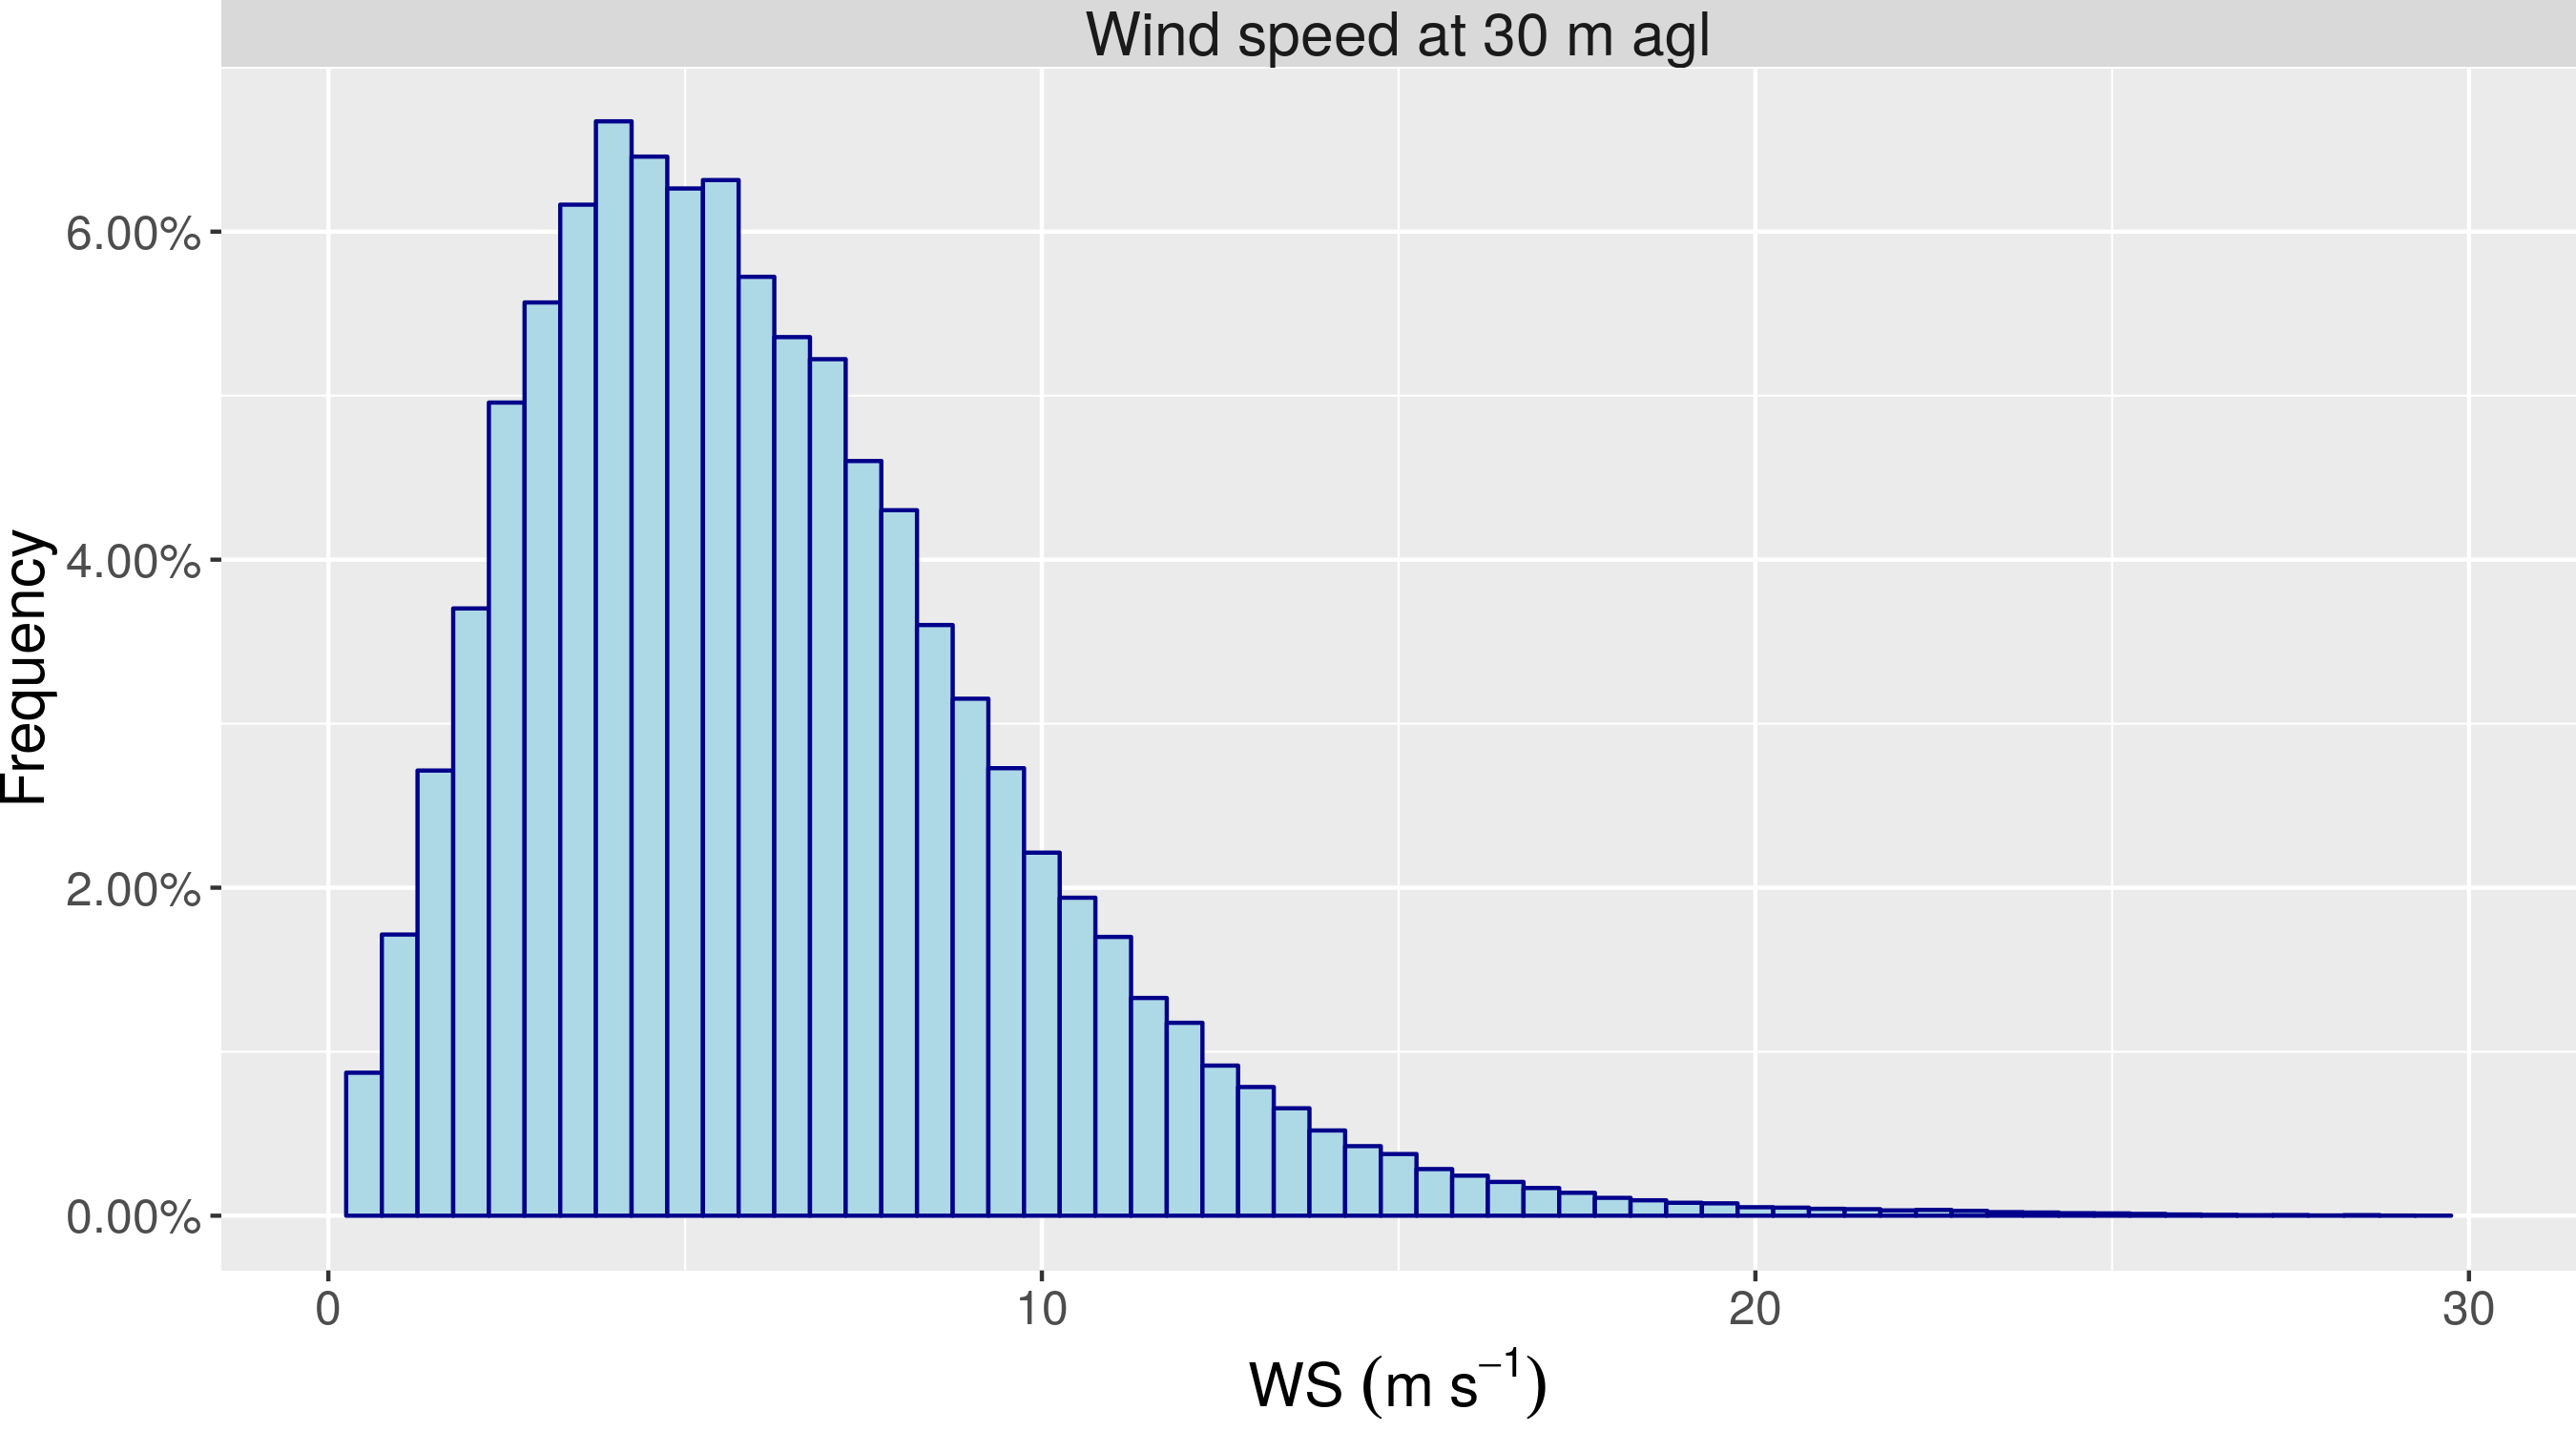
HISTOGRAMS
WIND SPEED VALUES GROUPED IN SECTORS OF 0.5 m/s
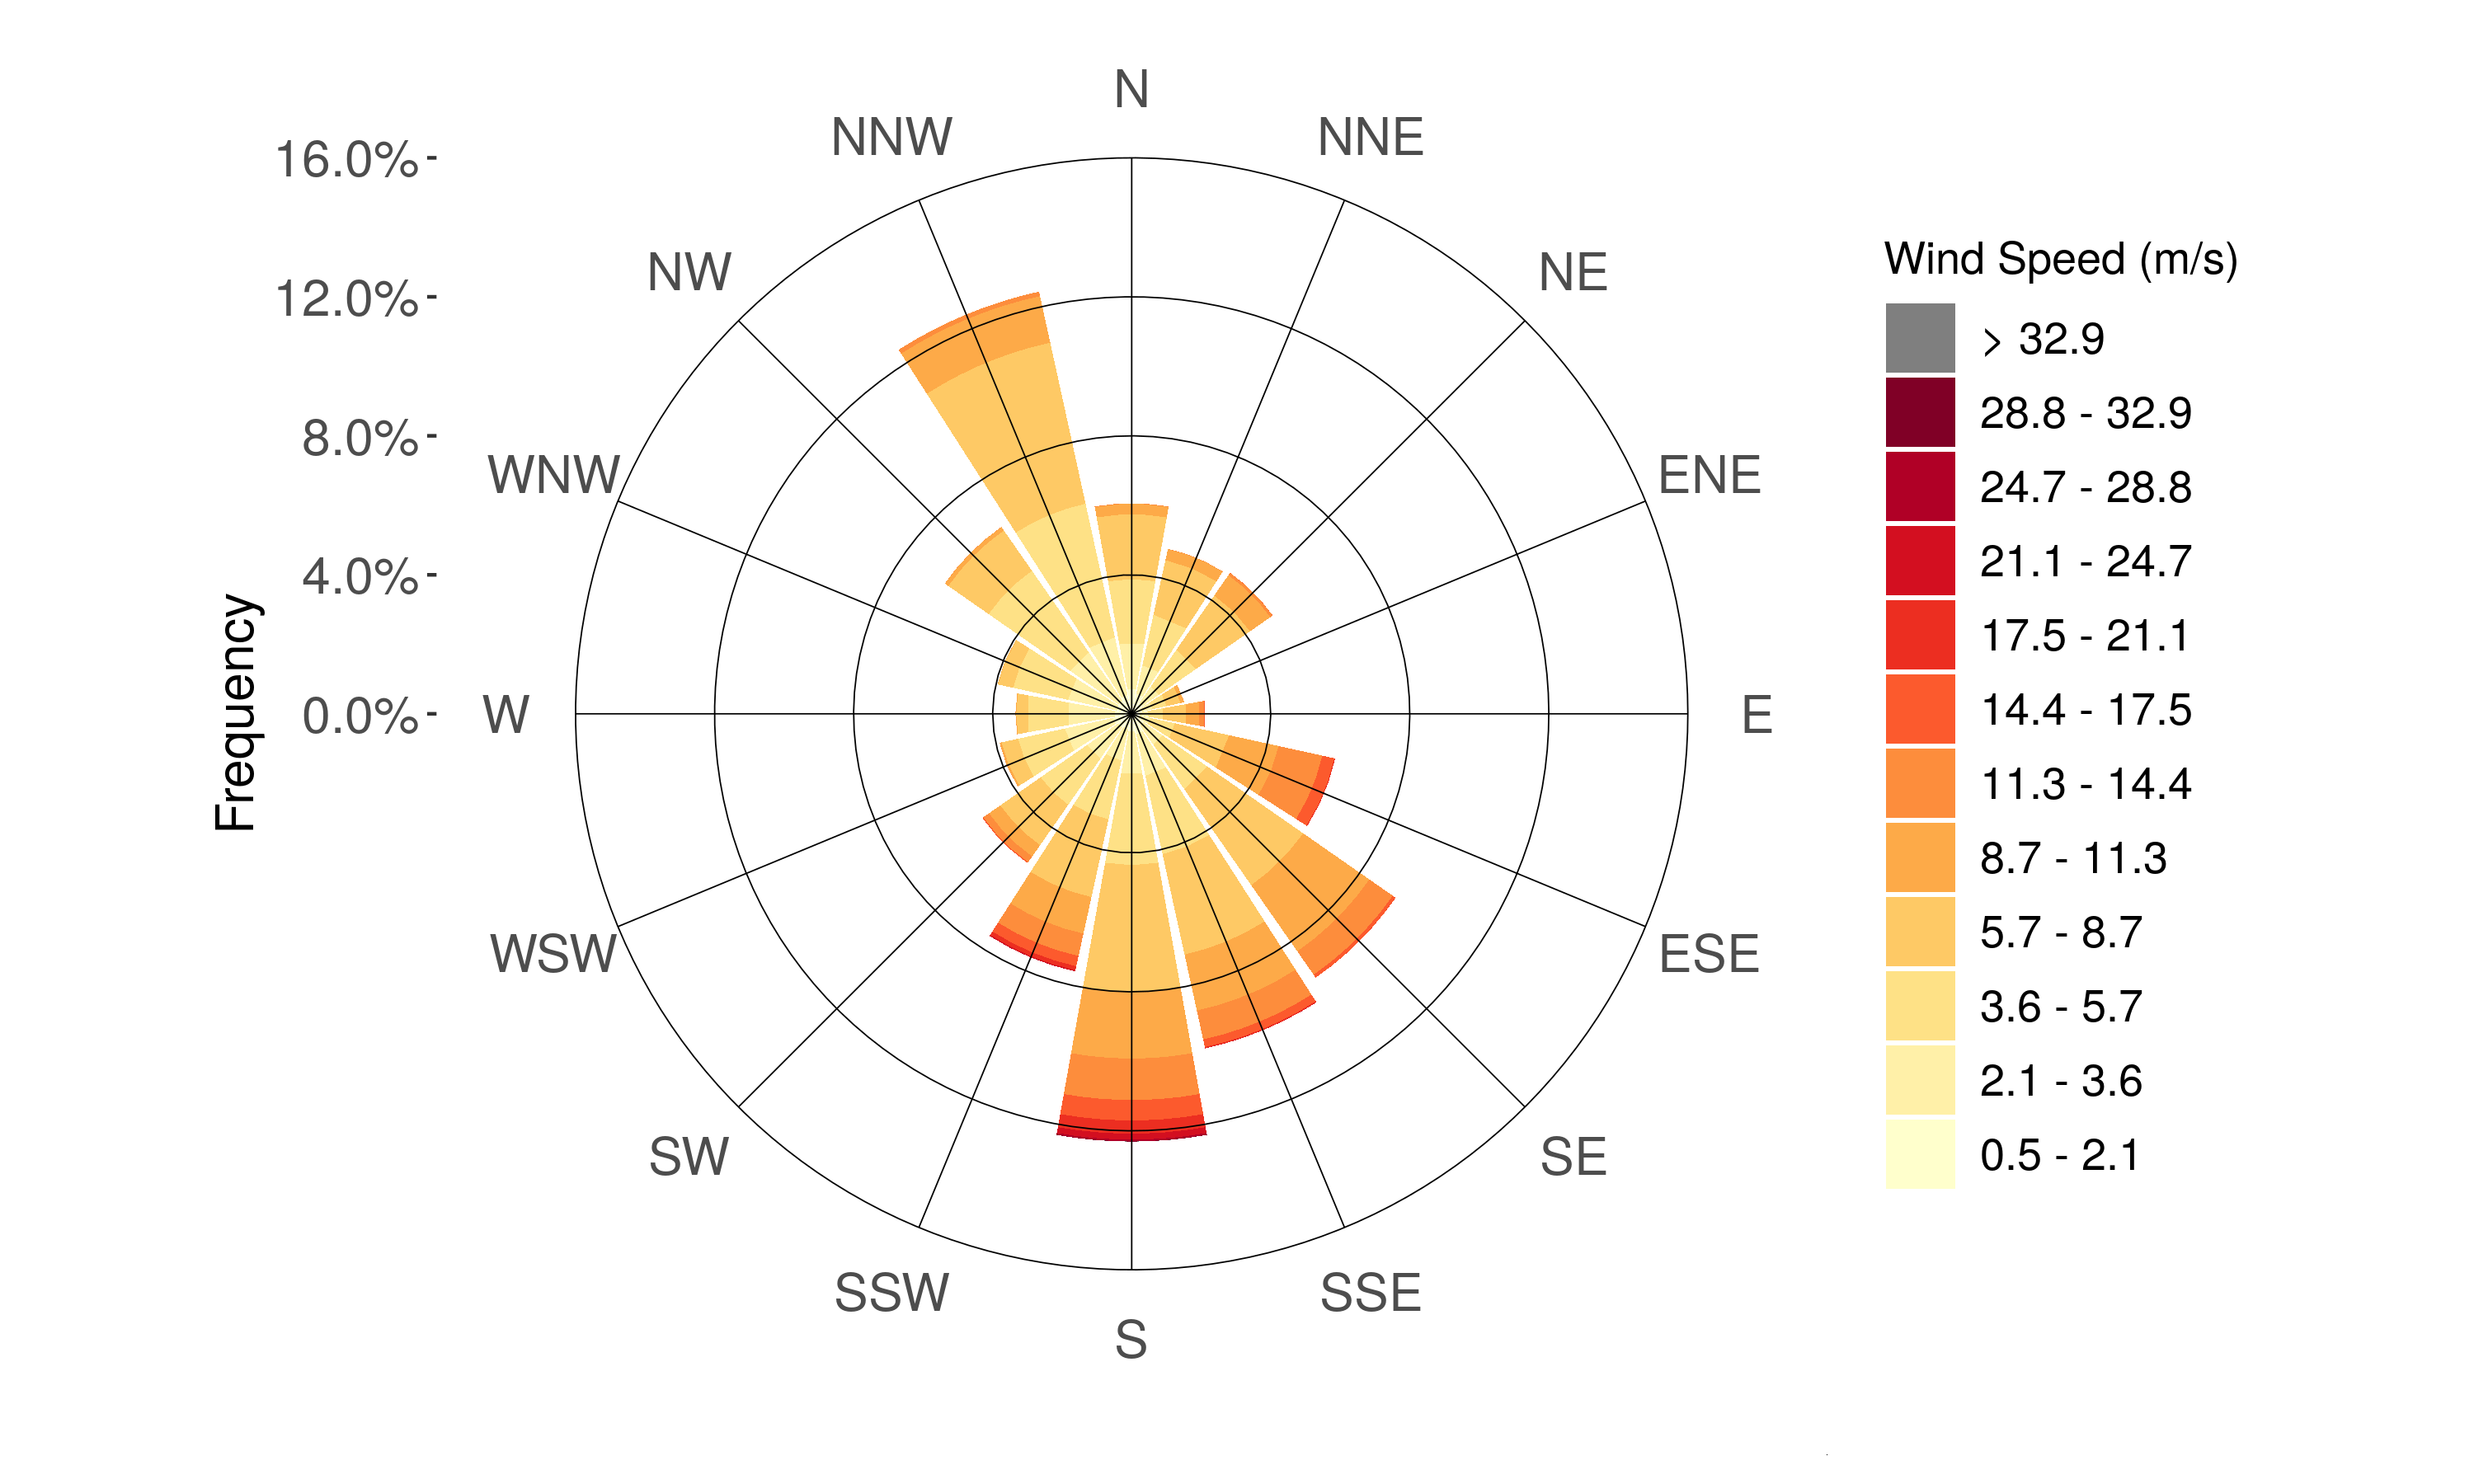
WIND ROSE
VERTICALLY AGGREGATED MEAN WINDS
MONTHLY WIND ROSES
VERTICALLY AGGREGATED MONTHLY MEAN WINDS

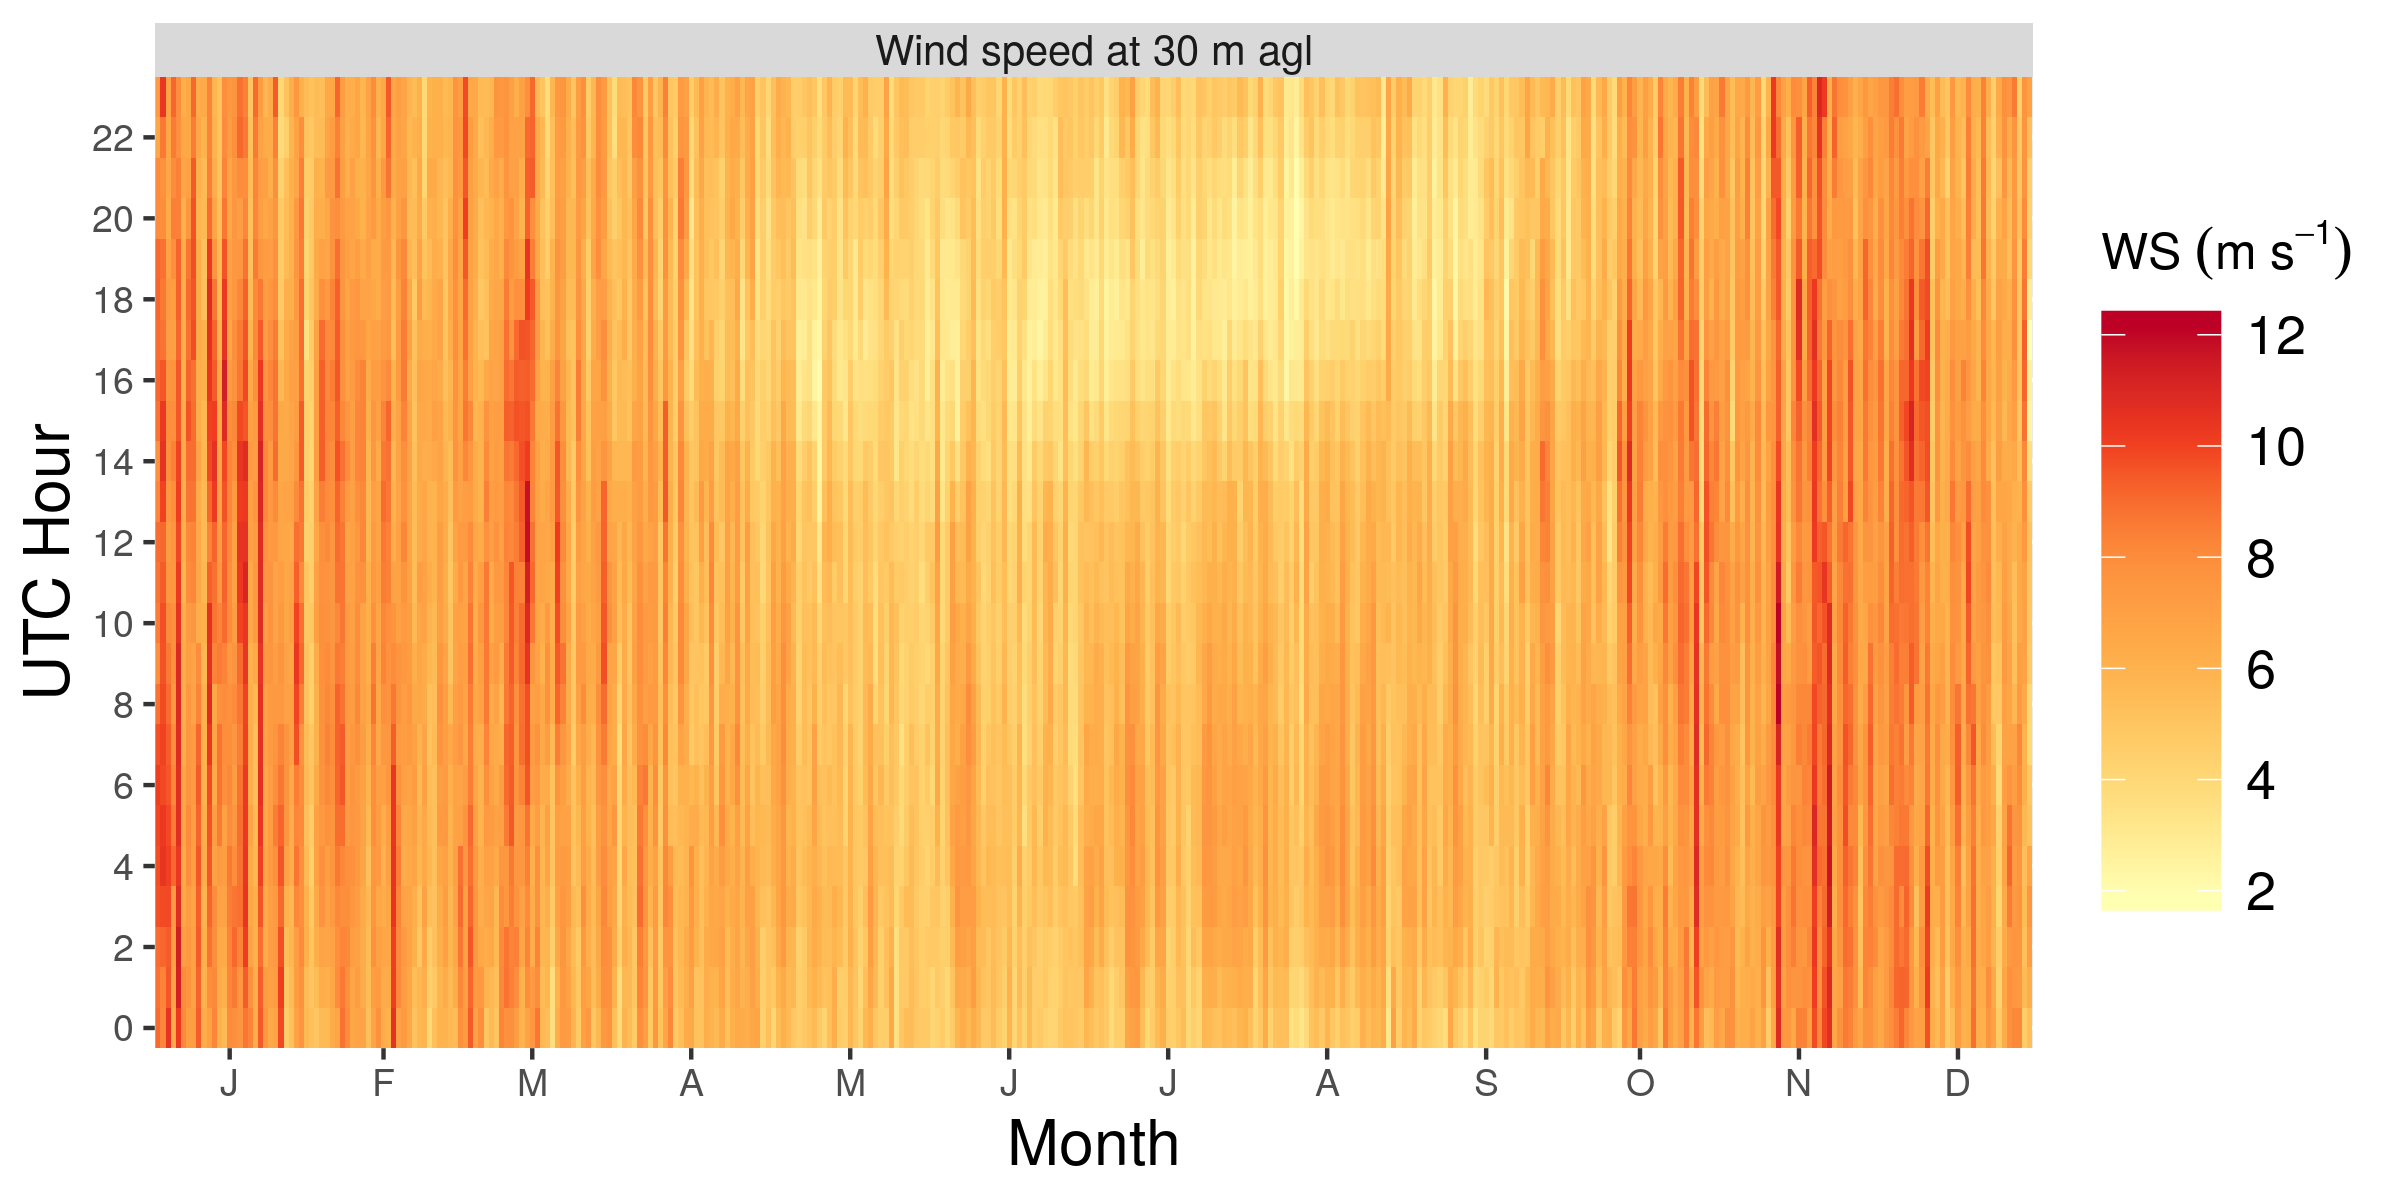
HEATMAPS
HOURLY MEAN WIND SPEEDS
For each day of the year (from 1 to 366), we show the hourly mean wind speeds. Seasonal and daily cycle