DETAILS AND LOCATION
Tower name
juelich
Institution
Research Center Juelich - Institute for Energy and Climate research (IEK-8)
First year
2011
Last year
2017
Tower type
Met mast
Contact
50.93, 6.22
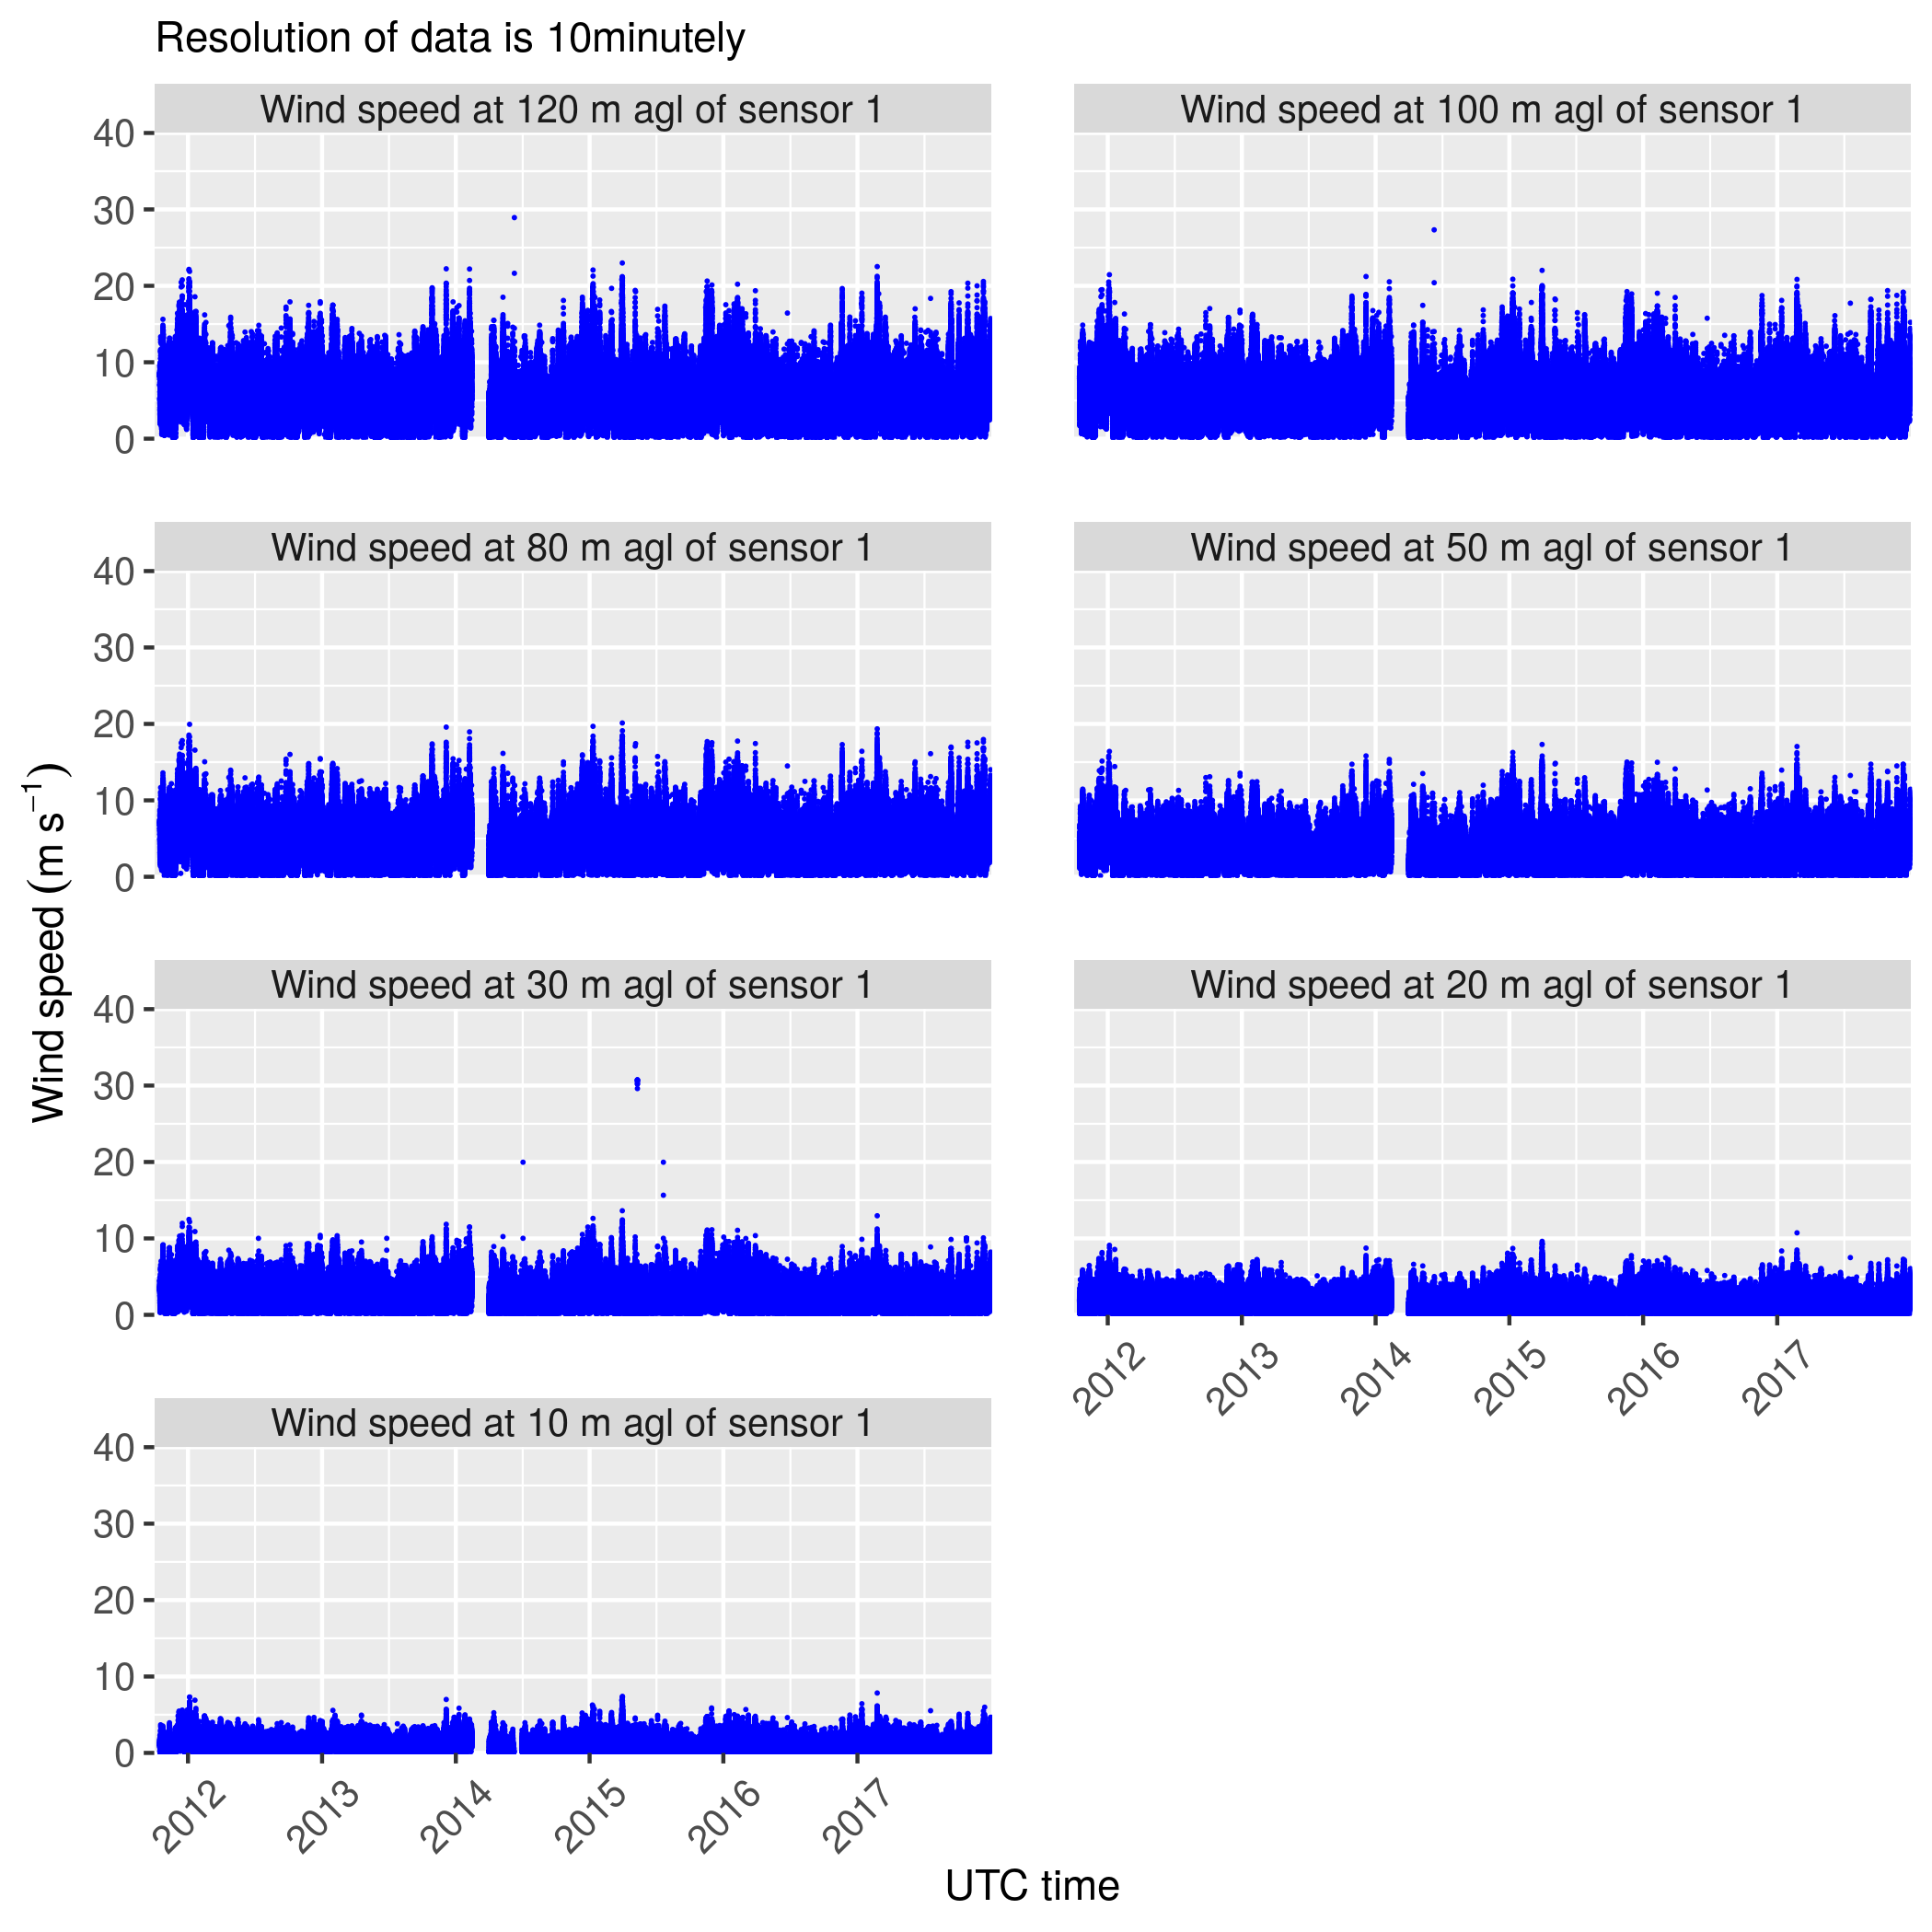
TIME SERIES
WIND SPEED SERIES AT THE DIFFERENT TOWER MEASURING LEVELS
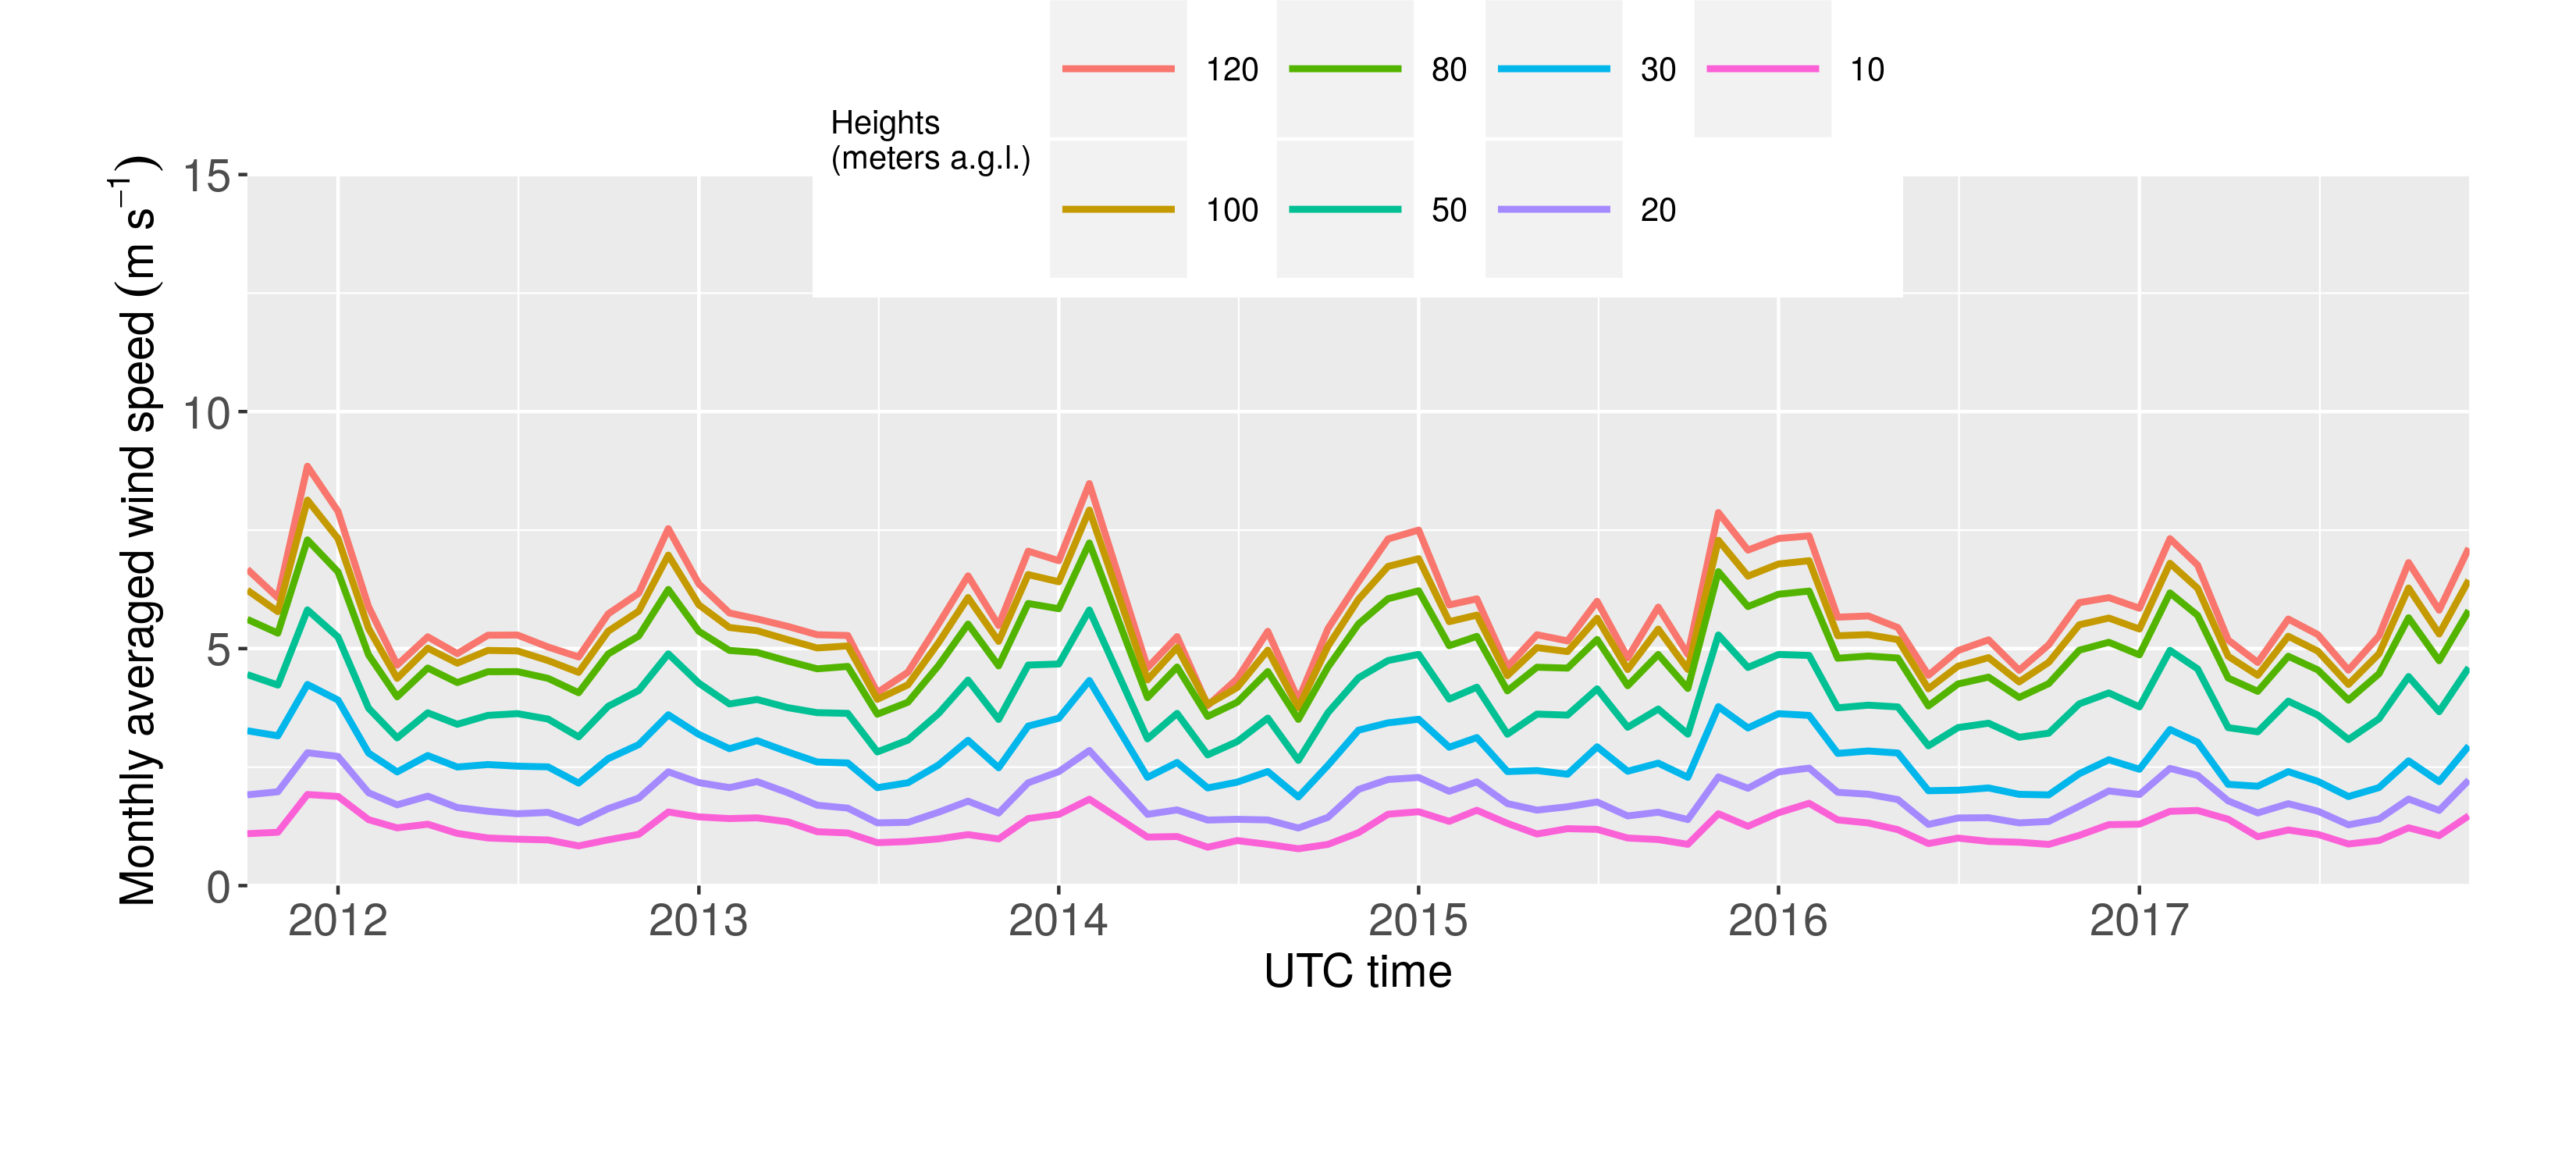
MONTHLY TIME SERIES
MONTHLY WIND SPEED SERIES AT THE DIFFERENT TOWER MEASURING LEVELS
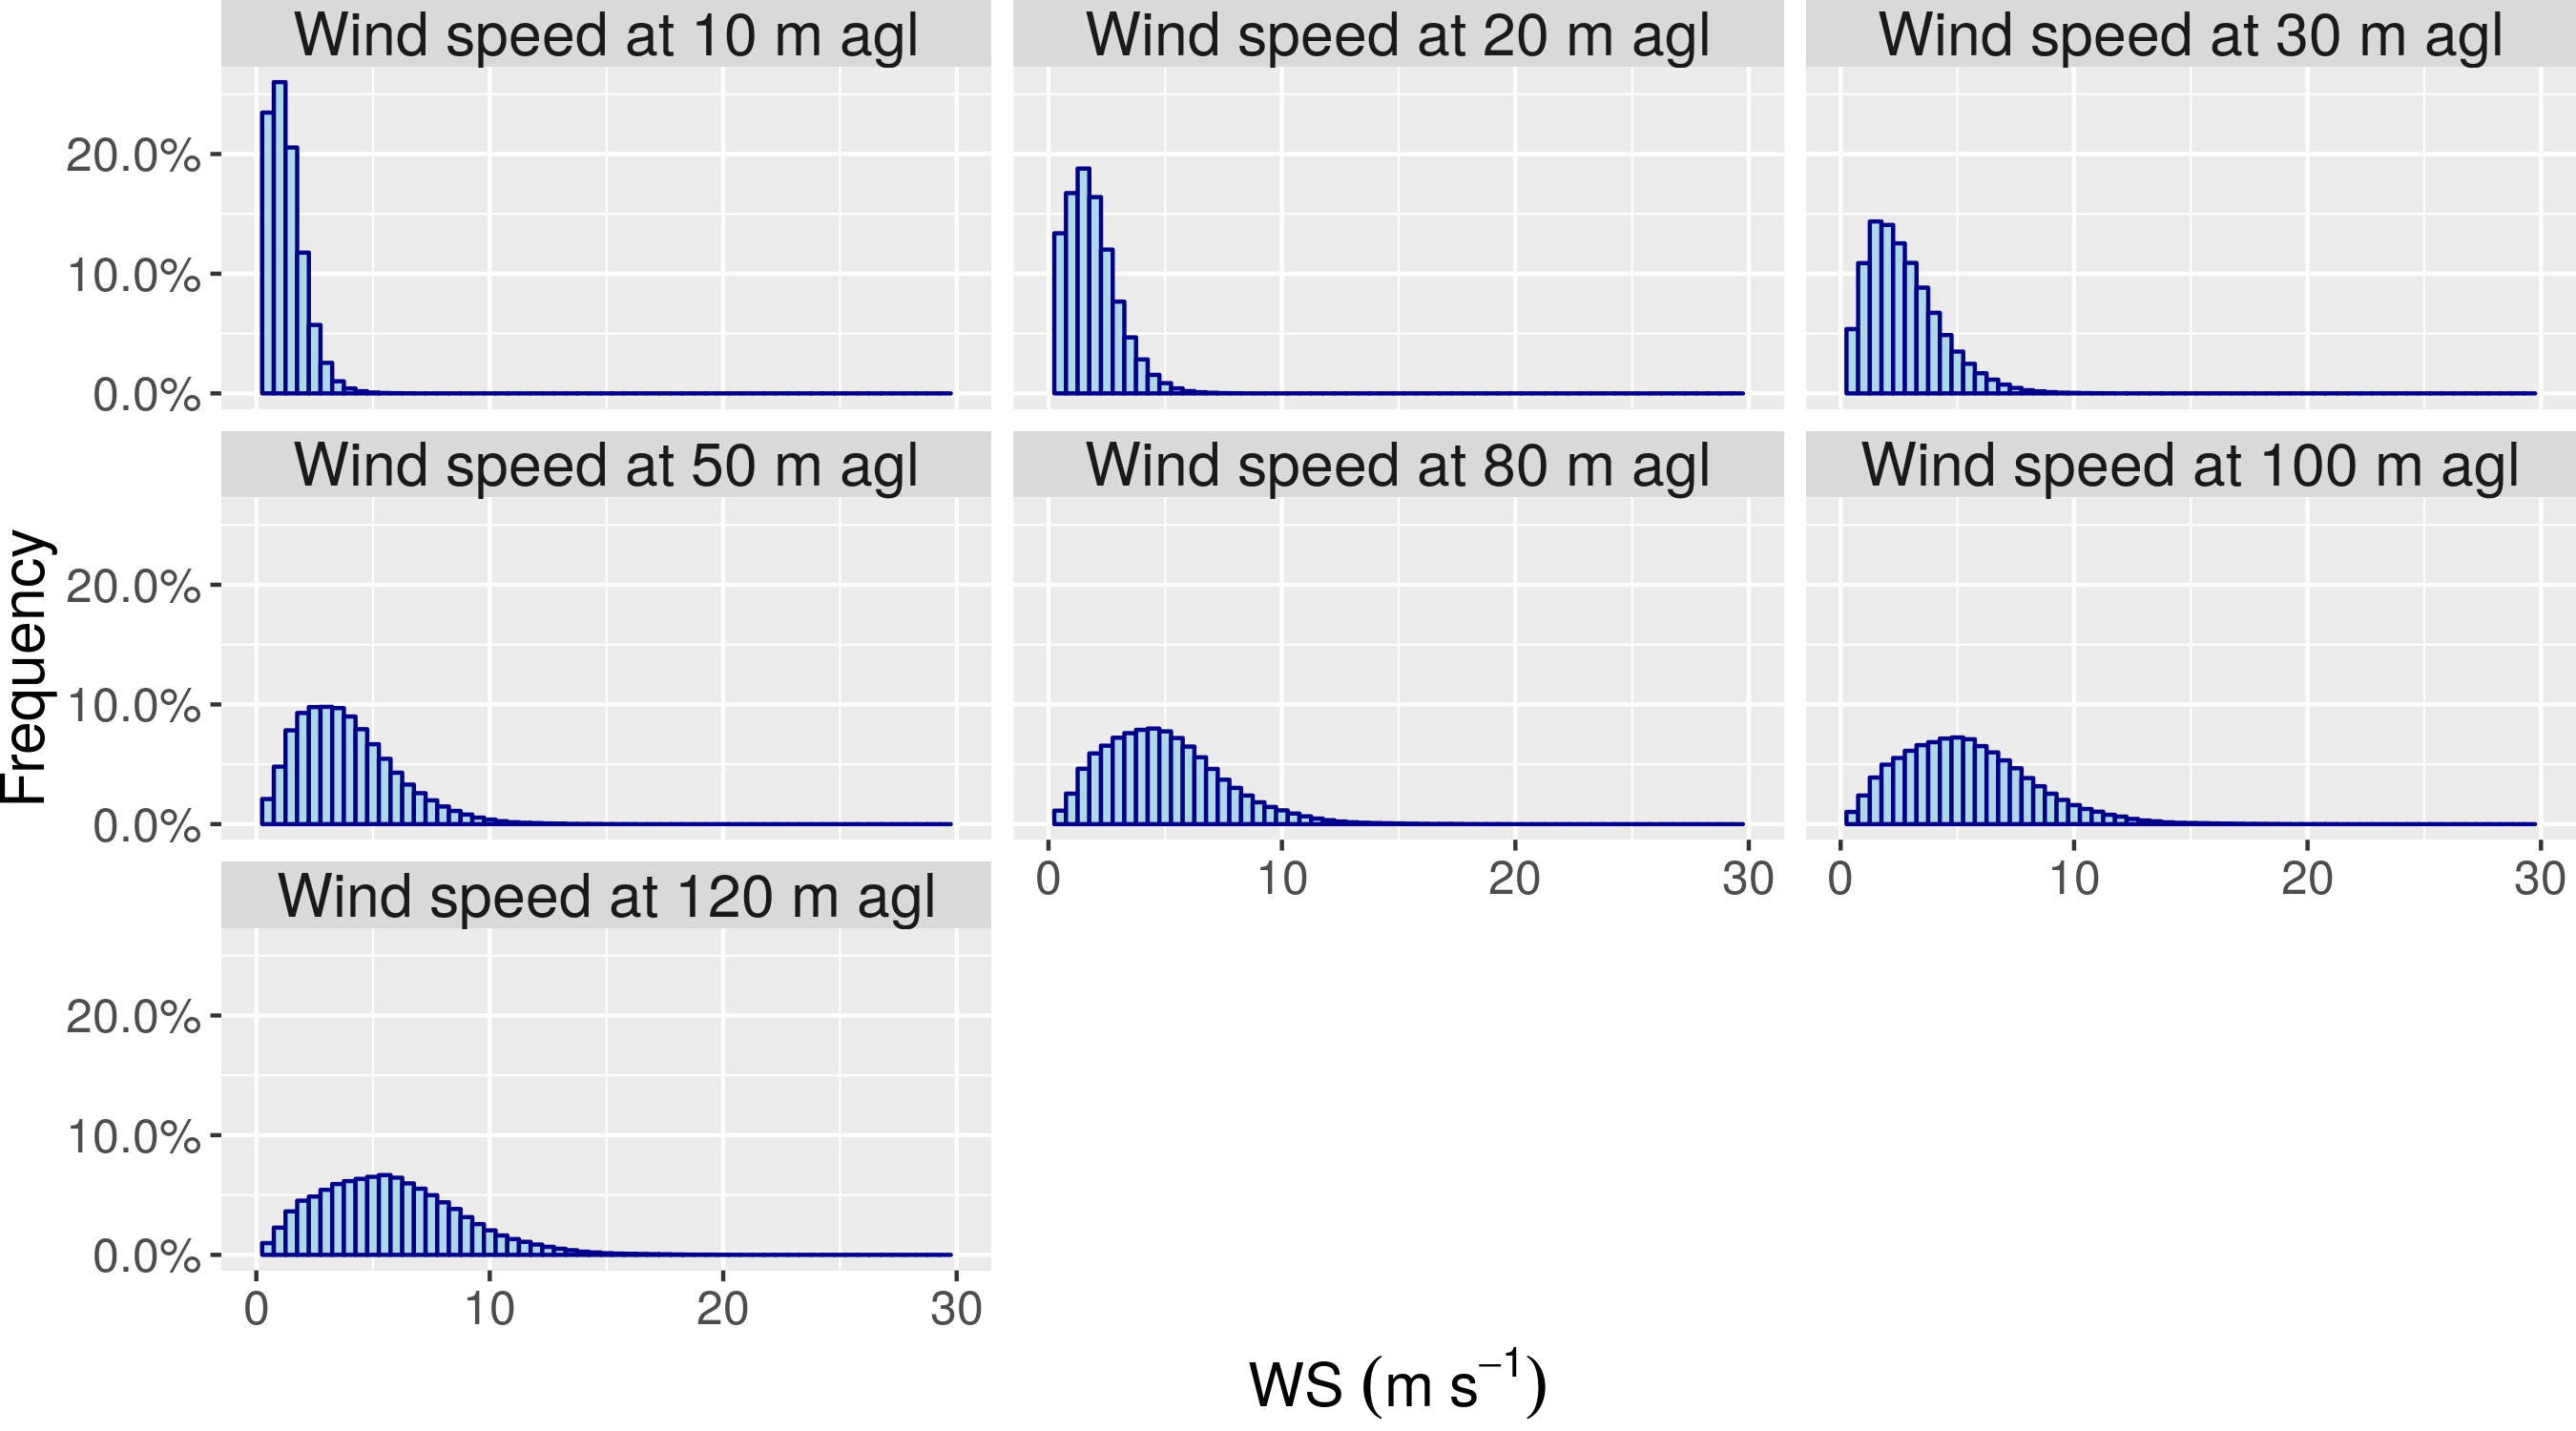
HISTOGRAMS
WIND SPEED VALUES GROUPED IN SECTORS OF 0.5 m/s
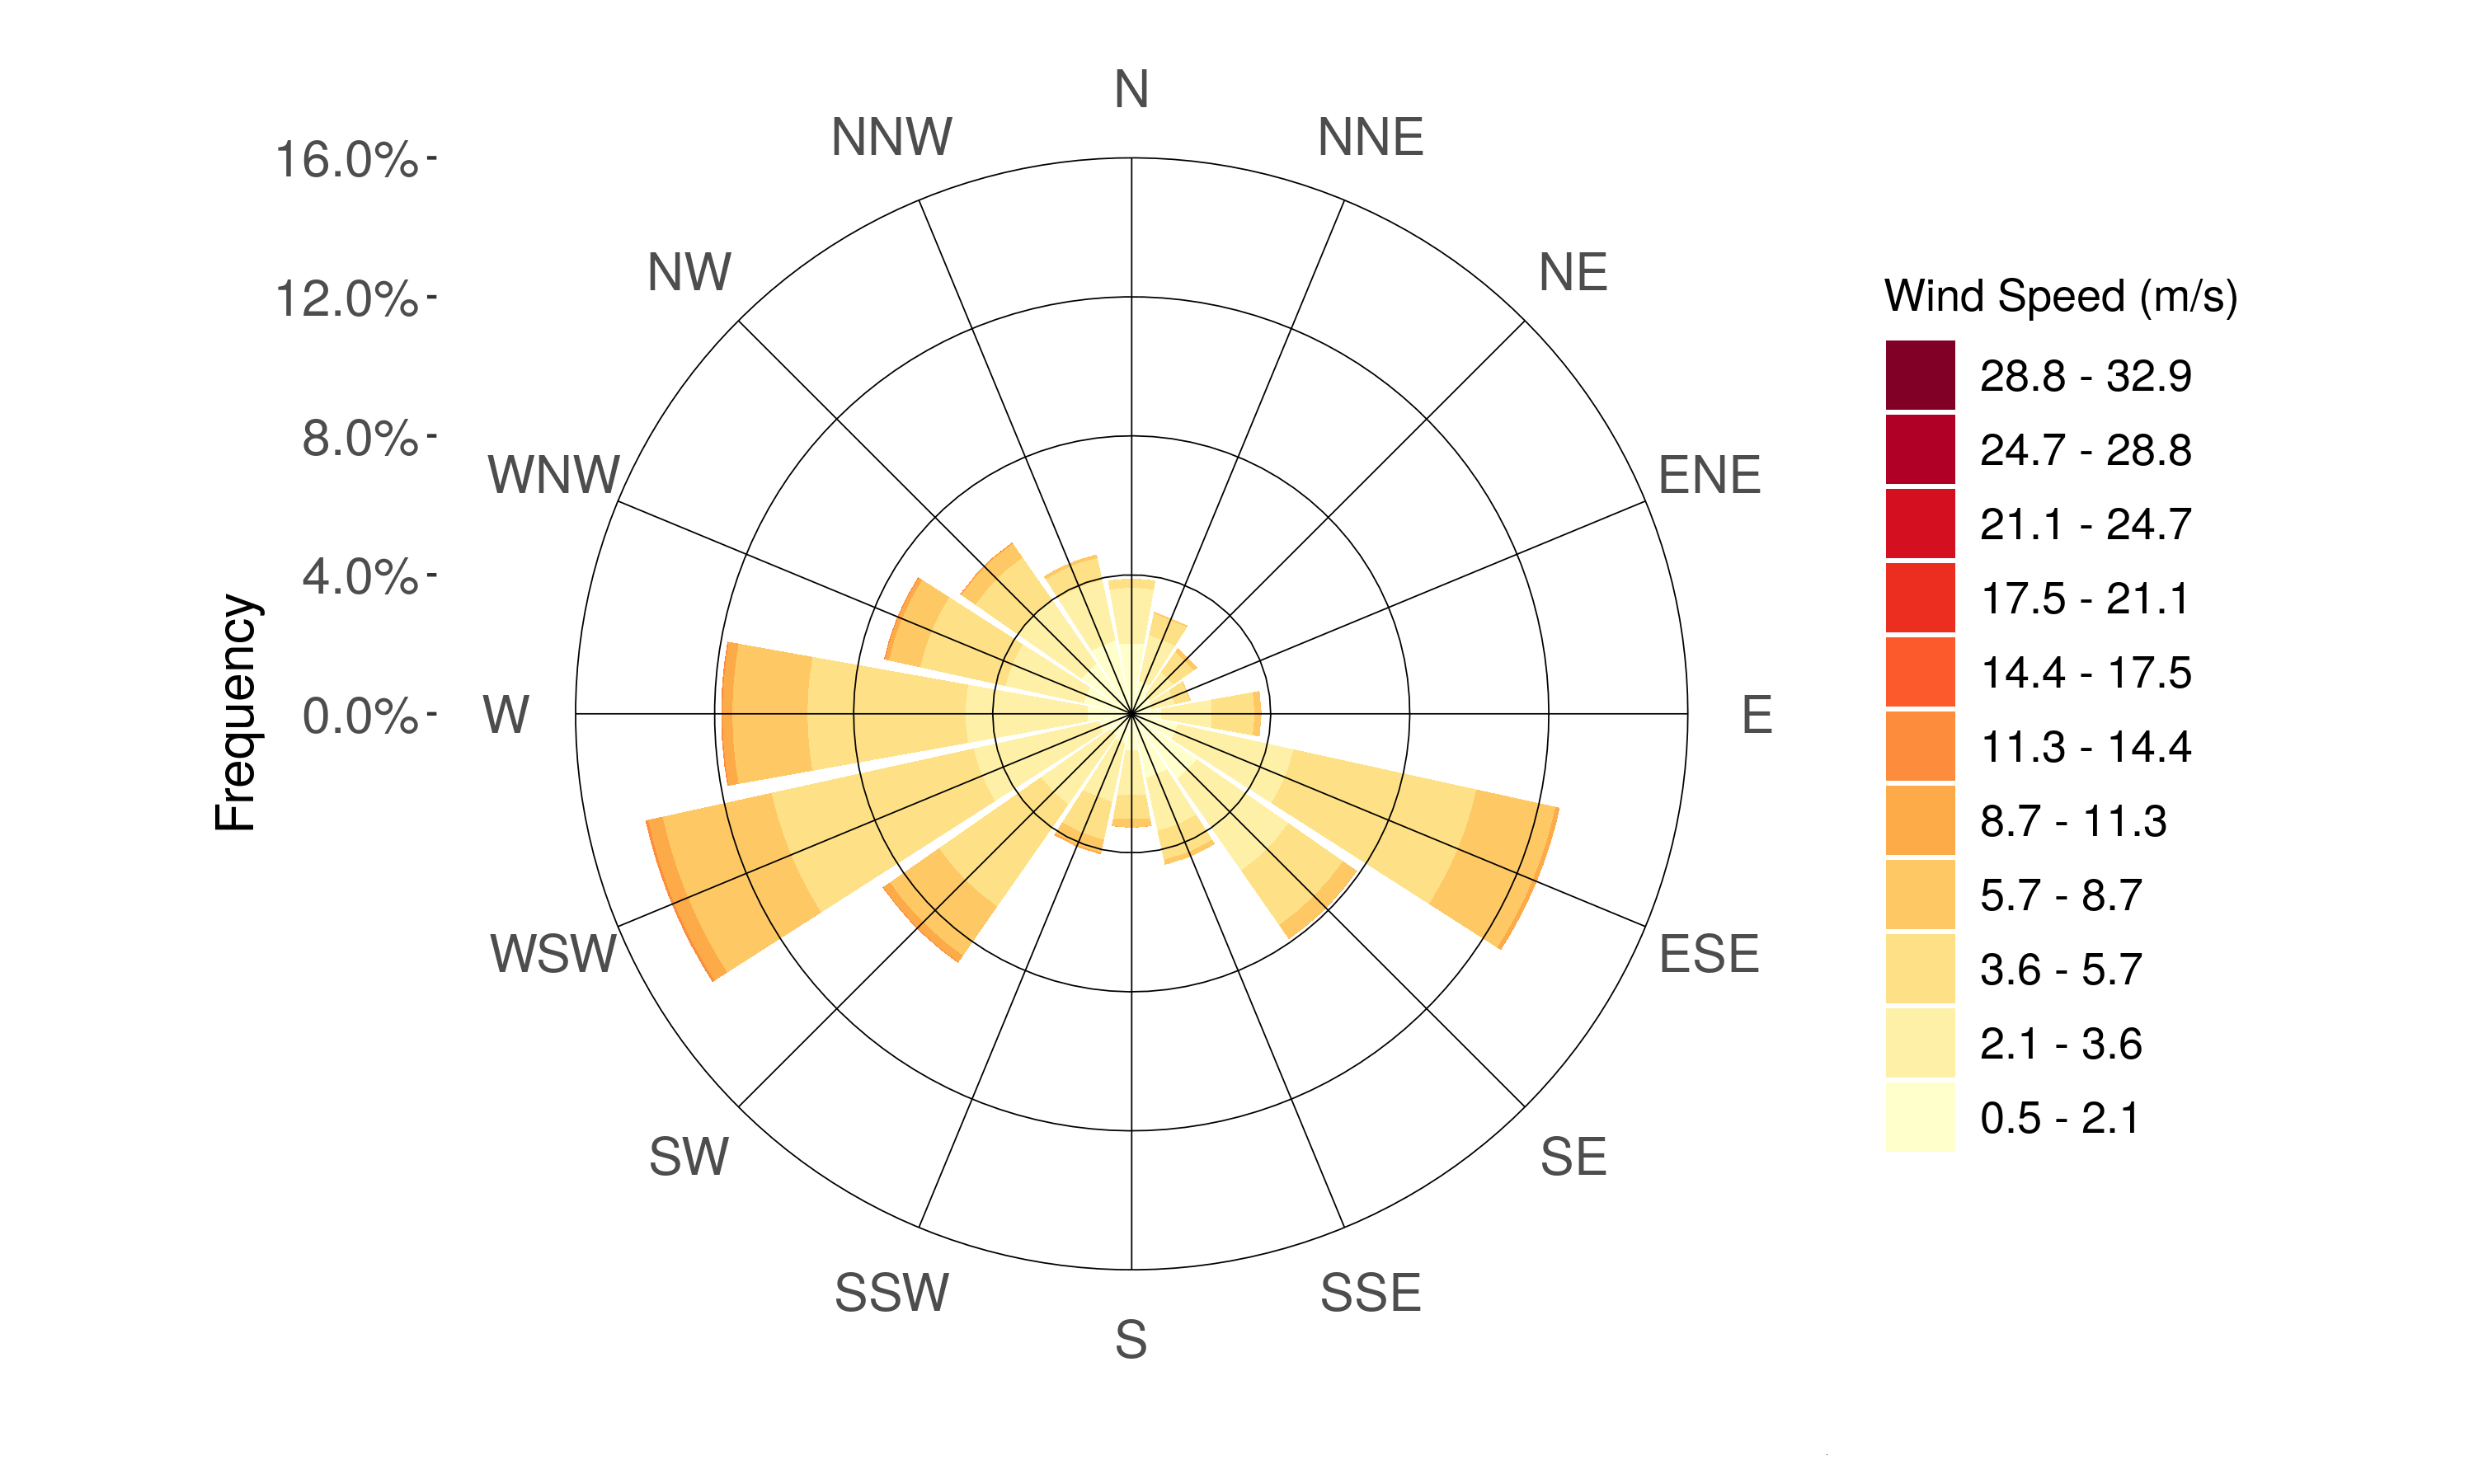
WIND ROSE
VERTICALLY AGGREGATED MEAN WINDS
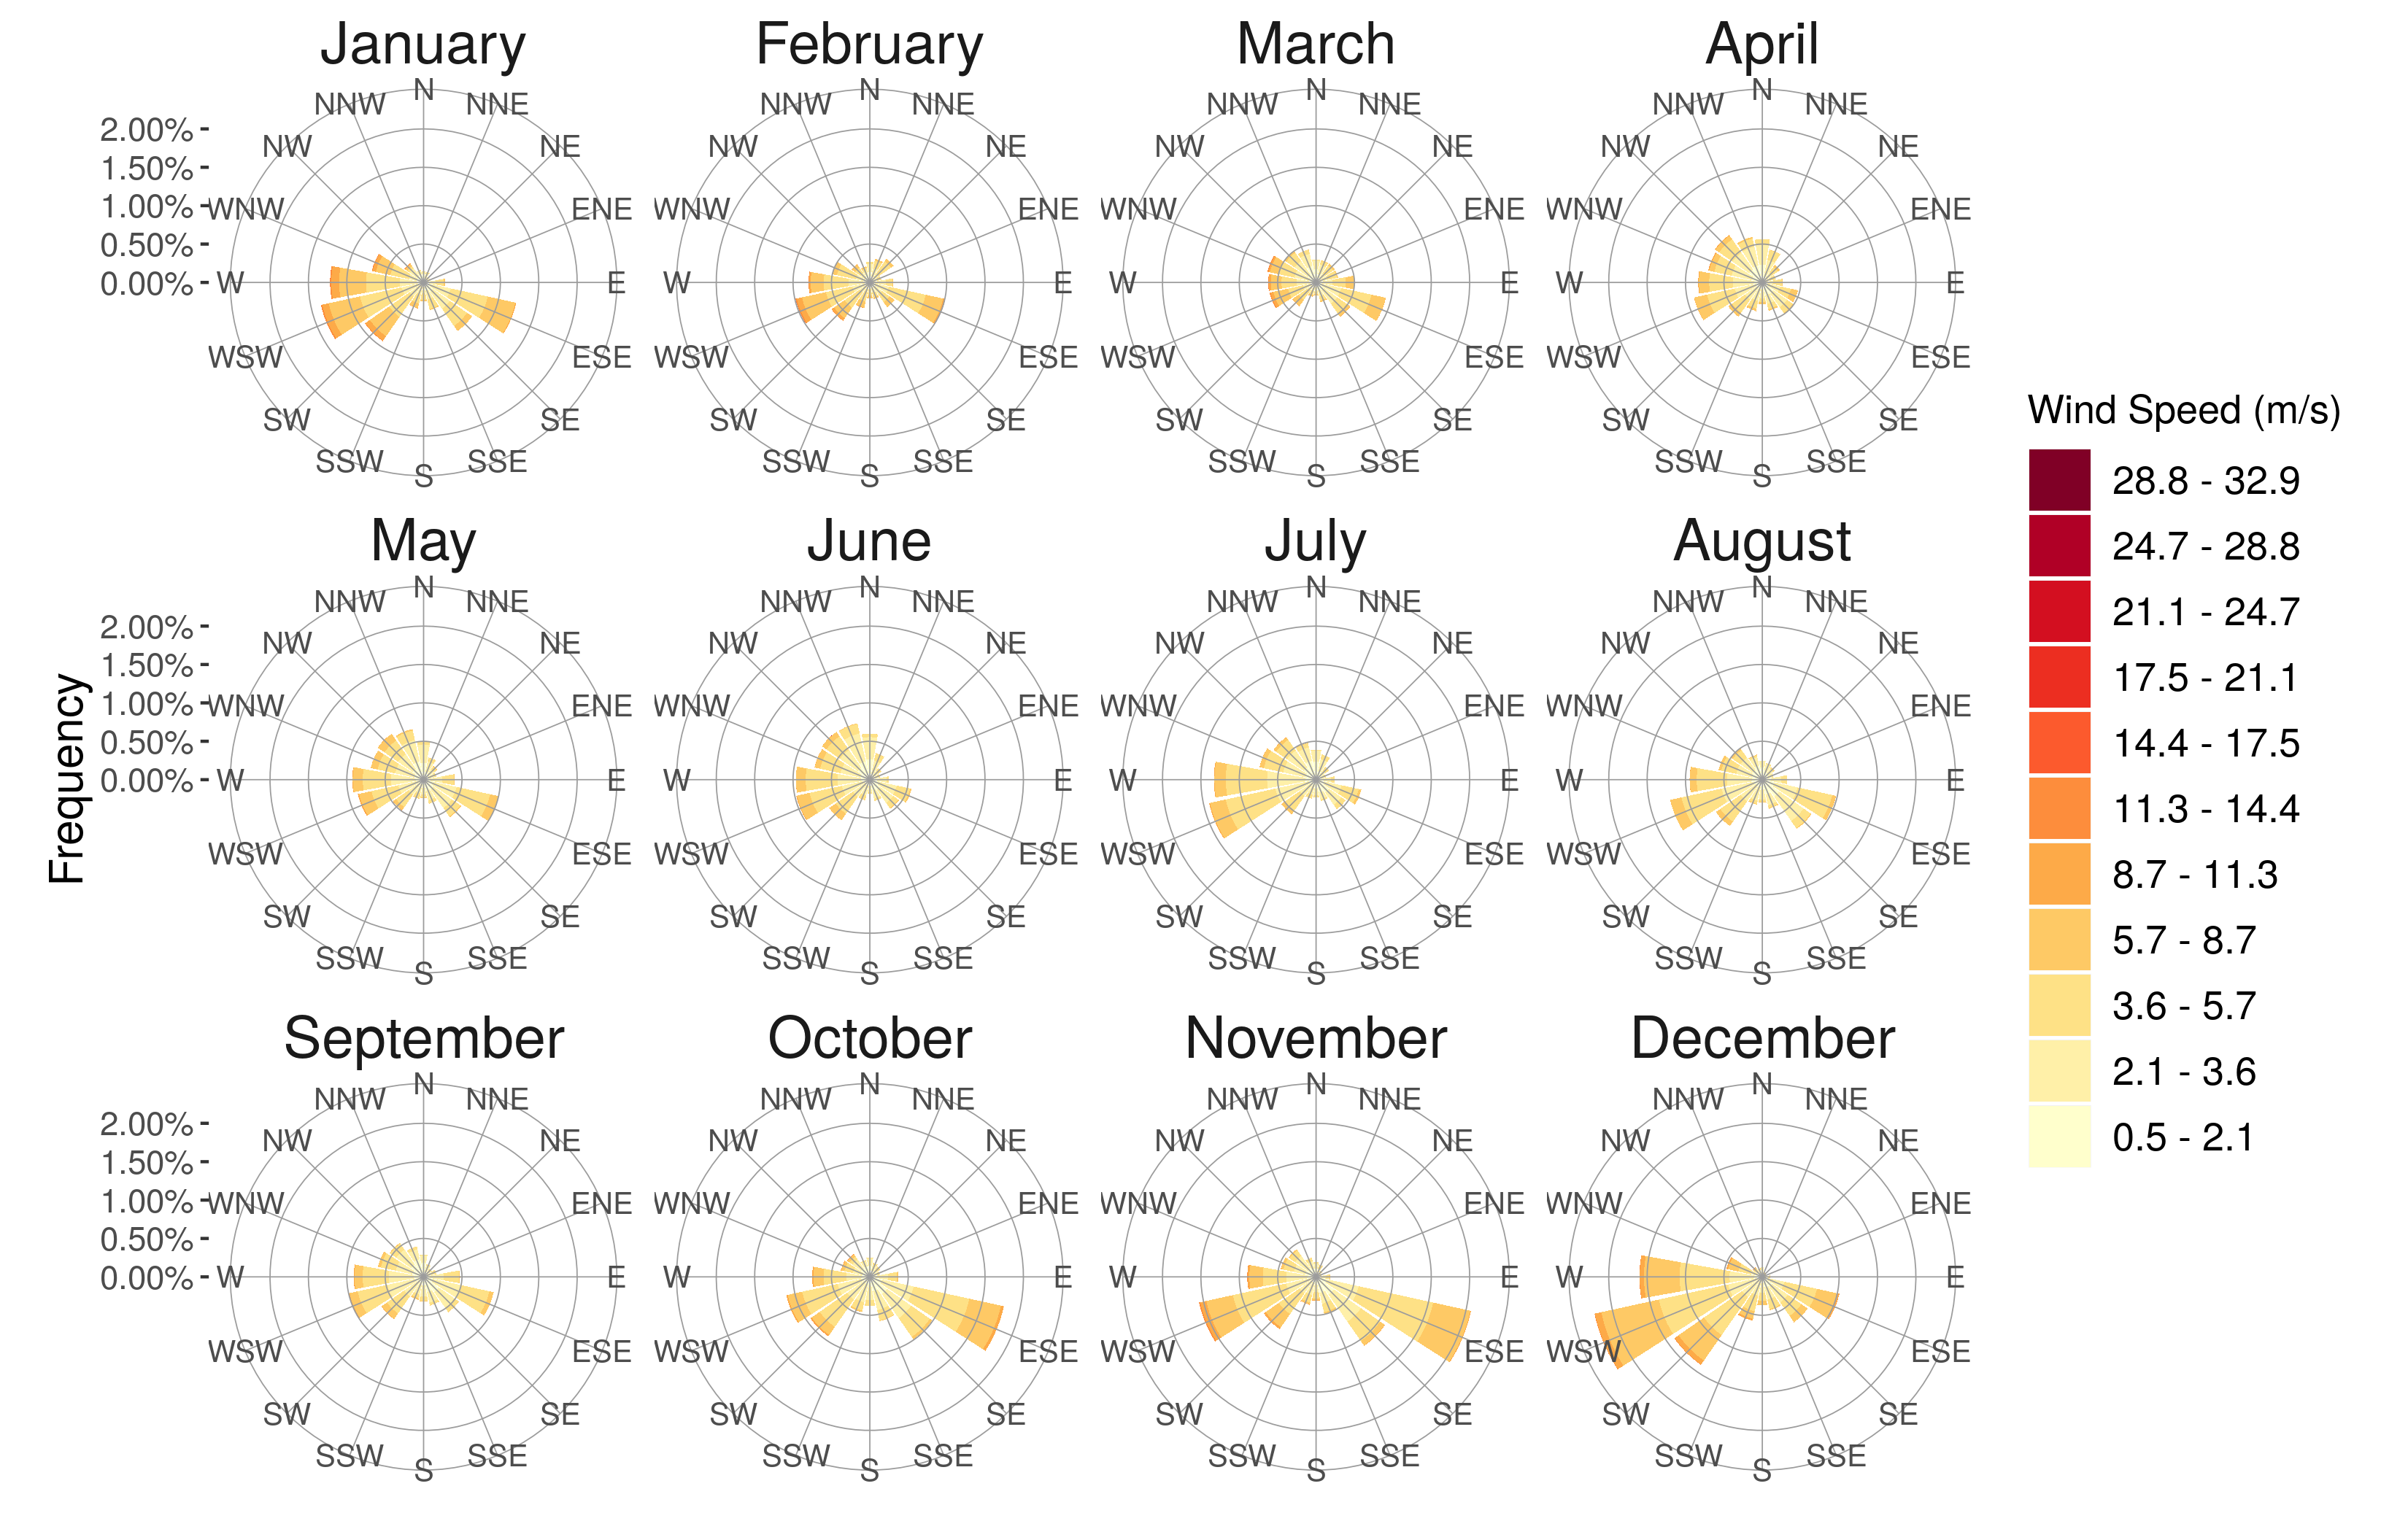
MONTHLY WIND ROSES
VERTICALLY AGGREGATED MONTHLY MEAN WINDS
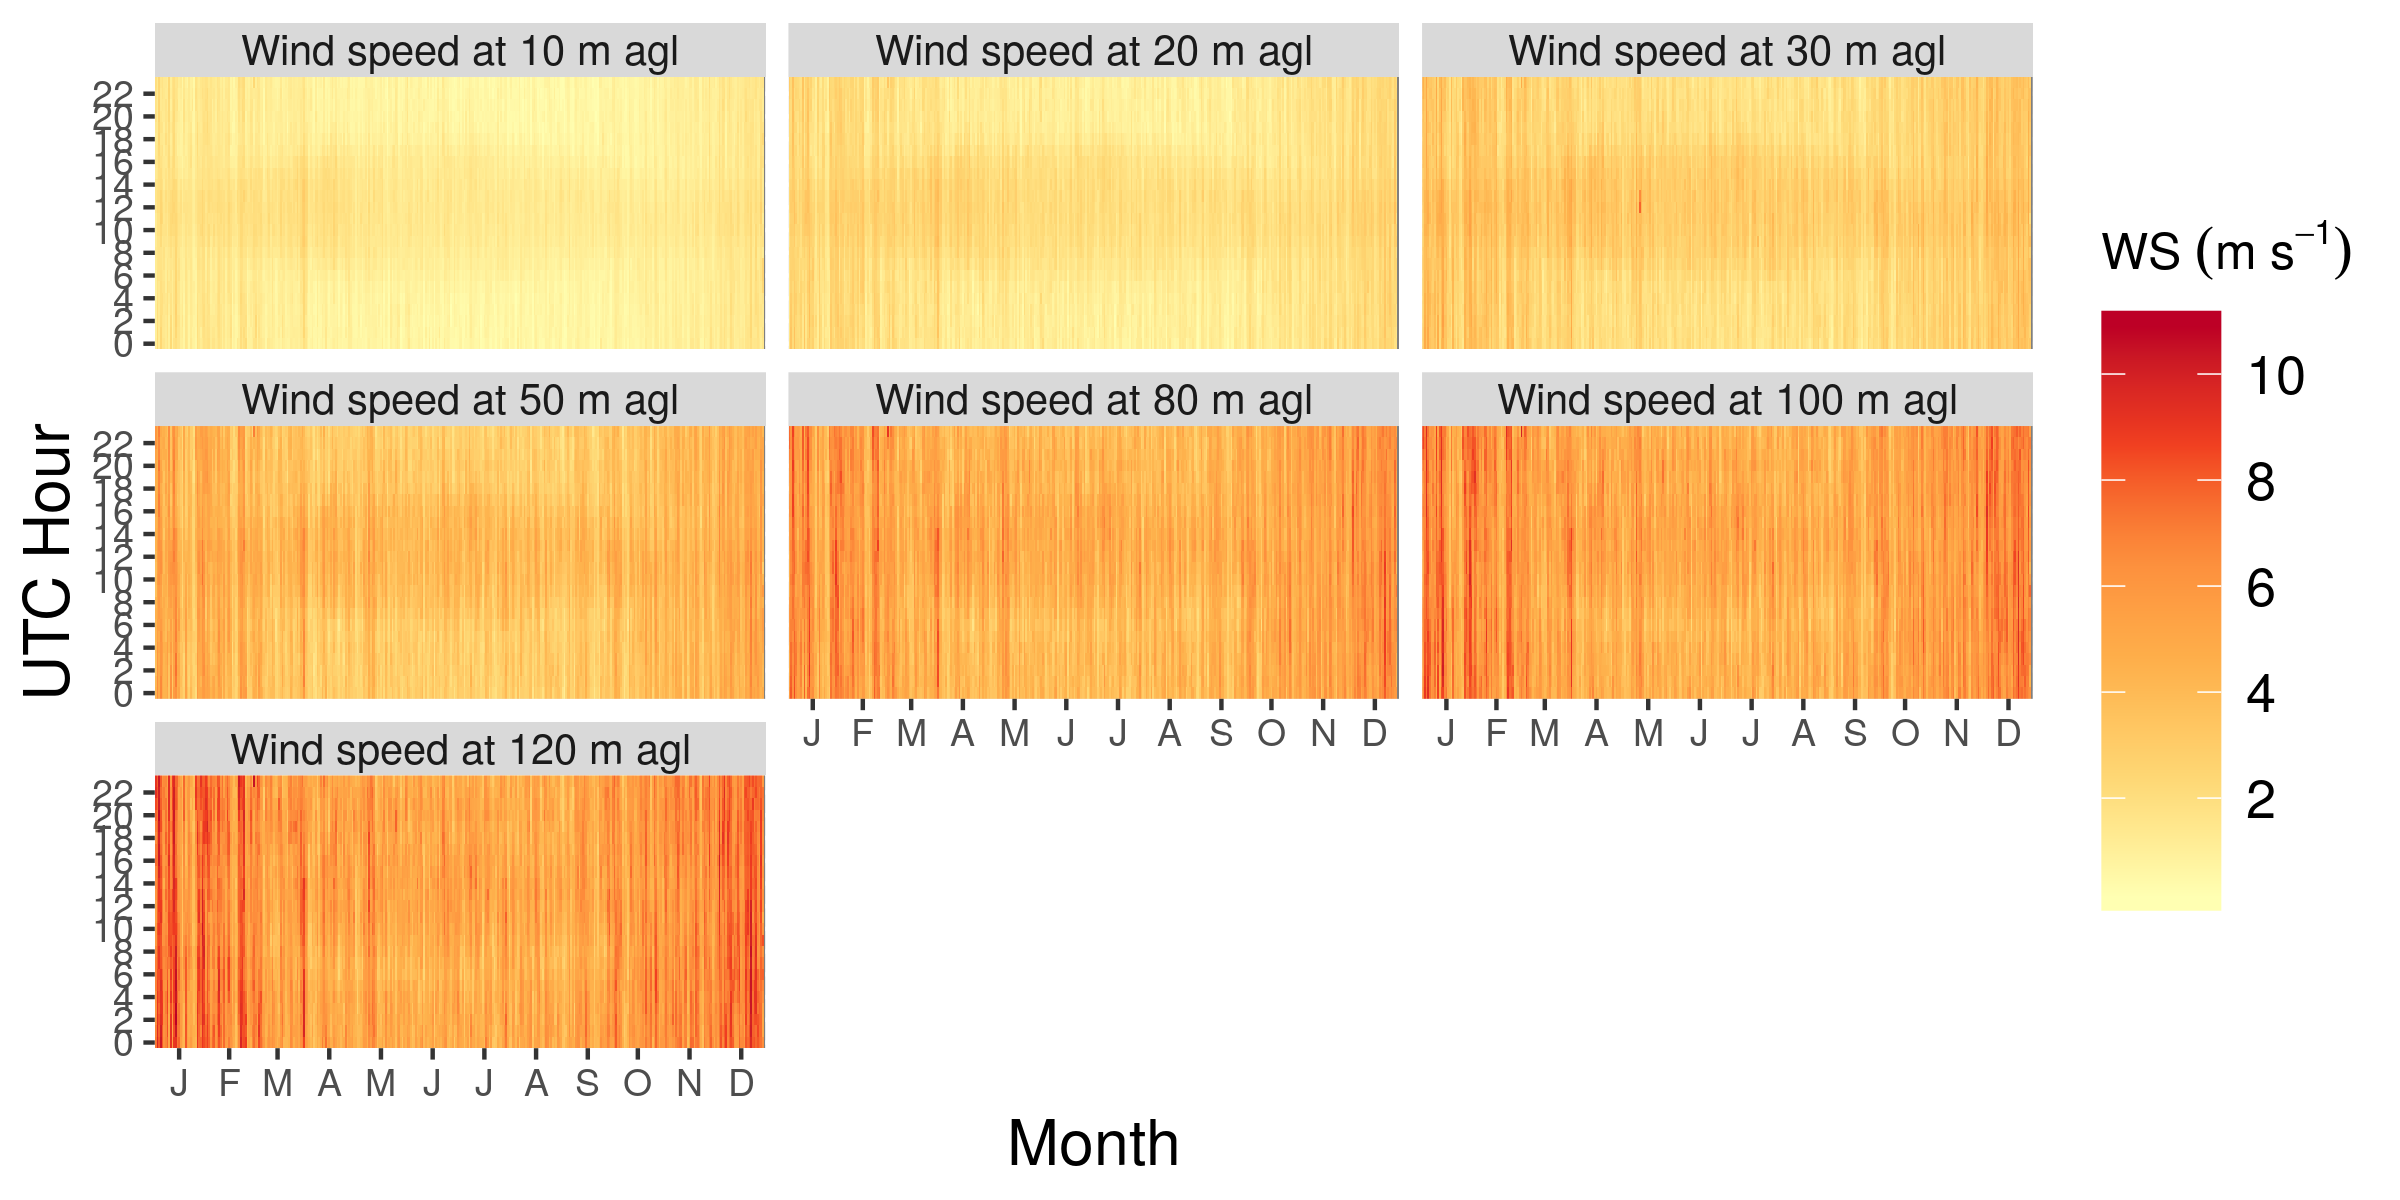
HEATMAPS
HOURLY MEAN WIND SPEEDS
For each day of the year (from 1 to 366), we show the hourly mean wind speeds. Seasonal and daily cycle